Target 10
By 2031, reduce the rate of Aboriginal and Torres Strait Islander adults held in incarceration by at least 15%.
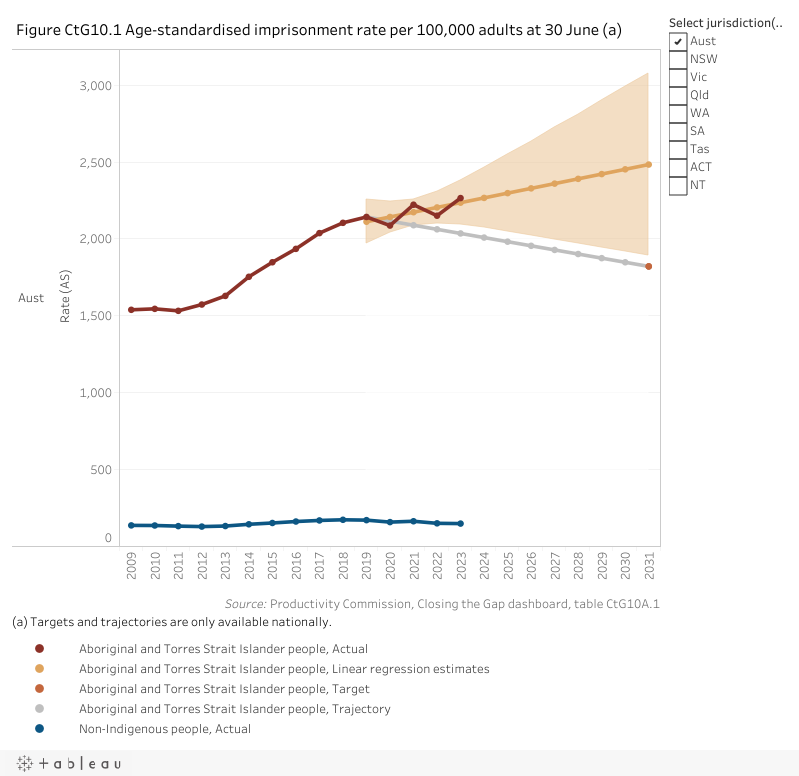
Nationally at 30 June 2023, the age-standardised rate of Aboriginal and Torres Strait Islander prisoners was 2,265.8 per 100,000 adult population (figure CtG10.1).
The 2023 rate is an increase from the previous year (2,151.1 per 100,000 adult population in 2022) and an increase from 2,142.9 per 100,000 adult population in 2019 (the baseline year).
Nationally, based on progress from the baseline, the target is worsening. This assessment is provided with a low level of confidence. Please refer to the How to interpret the data page for more information.
The assessment below reflects progress from the baseline (improvement, worsening or no change).
| NSW | Vic | Qld | WA | SA | Tas | ACT | NT | Aust | |
|---|---|---|---|---|---|---|---|---|---|
| Assessment of progress 2019 to 2023 |  |  |  | | | | | | |
| Confidence level | Low | Low | High | Low | Low | Low | Low | High | Low |
improvement no change worsening not applicable as required data not available.  good improvement and target on track to be met.
  improvement but target not on track to be met.
Note: These assessments of progress are provided with a 'High' or 'Low' level of confidence. An assessment reported with a High level of confidence is considered to be more reliable than one reported with a Low level of confidence. Please see the 'How to interpret the data' page for more information.
Disaggregations
Data tables appear under figures
By sex
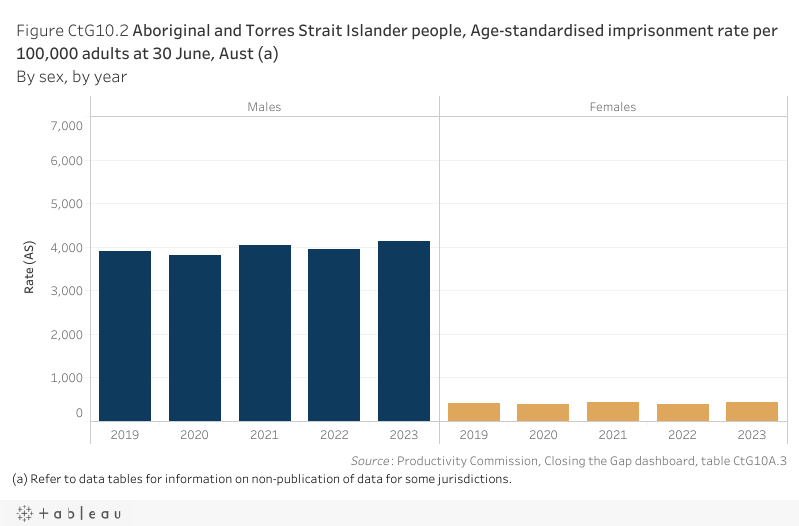
Nationally at 30 June 2023, the age-standardised rate of Aboriginal and Torres Strait Islander prisoners per 100,000 people was higher for males (4,128.9) compared to females (425.4) (figure CtG10.2).
By age group
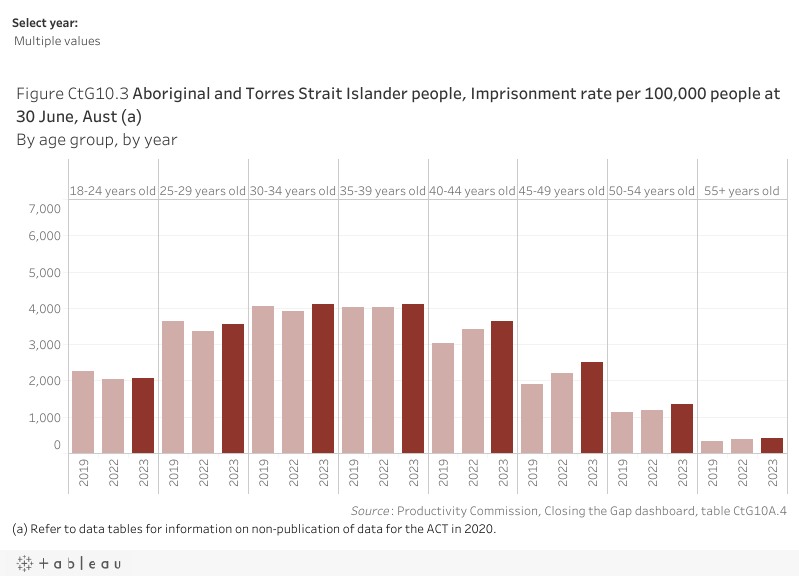
Nationally at 30 June 2023, there were 2,057.1 Aboriginal and Torres Strait Islander prisoners aged 18–24 years per 100,000 people in the population group (figure CtG10.3). The Aboriginal and Torres Strait Islander imprisonment rate increased with age group until peaking at 4,110.4 per 100,000 people aged 35–39 years, but declined with each successive age group thereafter (to 407.7 prisoners per 100,000 people aged 55 years or over).
By sex, by age group
Data on imprisonment rates, by Indigenous status, by sex, by age group is available in table CtG10A.5.
Target data specifications
Outcome: | Aboriginal and Torres Strait Islander people are not overrepresented in the criminal justice system. |
|---|---|
Target: | By 2031, reduce the rate of Aboriginal and Torres Strait Islander adults held in incarceration by at least 15%. |
Indicator: | Age‑standardised imprisonment rate. |
Measure: | The measure is defined as: Numerator – number of Aboriginal and Torres Strait Islander people aged18 years or over in the legal custody of adult corrective services at 30 June Denominator – number of Aboriginal and Torres Strait Islander people aged18 years or over at 30 June and is presented as an age‑standardised rate per 100,000 people. |
Target established: | National Agreement on Closing the Gap July 2020 |
Latest dashboard update: | 6 March 2024 |
Indicator type: | Target |
Interpretation of change: | A low or decreasing rate is desirable. |
Data source(s): | Name (numerator): Prisoners in Australia Frequency: Annual (revised data for 2019 in the March 2022 Dashboard update). Name (denominator): Estimates and Projections for Aboriginal and Torres Strait Islander population Frequency: Annual (revised data for 2017, 2018, 2019 and 2020 in the March 2022 Dashboard update). Documentation (links): https://www.abs.gov.au/statistics/people/crime-and-justice/prisoners-australia |
Data provider: | Provider name: Australian Bureau of Statistics (ABS) Provider area: Justice |
Baseline year: | 2019 |
Latest reporting period: | 2022 |
Target year: | 2031 |
Disaggregations: | State and territory and Australia, by Indigenous status. State and territory and Australia, by Indigenous status, by sex. State and territory and Australia, by Indigenous status, by age group. State and territory and Australia, by Indigenous status, by sex, by age group. |
Computation: | Numerator divided by Denominator multiplied by 100 000 and age standardised. Counting rules (excluding disaggregation differences noted above) From 2019, in all states and territories, persons remanded or sentenced to adult custody are aged 18 years or over. Aboriginal and Torres Strait Islander rate: rates are calculated based on estimates of the Aboriginal and Torres Strait Islander population based on Series B projections for 30 June of the relevant calendar year. Non-Indigenous rate: rates are calculated based on estimates of the non‑Indigenous population derived as the difference between the estimated resident population as at 31 March and the Aboriginal and Torres Strait Islander population projections as at 30 June for the relevant calendar year. Age-standardised rate: rates are calculated using the direct method of age standardisation. This is a standard methodology and consists of:
Disaggregations: Sex: Sex relates to biological primary sexual characteristics. Prisoners are housed according to sex so are recorded as male and female in that context. Sex is as recorded on the administrative records of the Corrective Services agencies. The standard ABS definition of sex is used, which includes categories for 'Male', 'Female', 'Other' and 'Unknown'. Prisoners classified with 'Other' or 'Unknown' are included in totals (where applicable), very few prisoners have Other or Unknown sex. Age: Date of birth is used to calculate age at 30 June of the reference year. Prisoners with unavailable/missing date of birth are still included in total counts of prisoners (very few prisoners have an unknown age). Totals for age tables may include prisoners whose age is unknown. Components may not add to total due to the effects of perturbation. |
Data quality considerations: | It is not possible to reproduce the exact age-standardised rates as published in the ABS releases on Prisoners in Australia as the rates calculated using the method described above are based on unperturbed data, whereas the published data by age range is perturbed to protect the confidentiality of individuals. Comparisons of imprisonment rates should be made with care, especially for states and territories with relatively small Aboriginal and Torres Strait Islander populations. Please refer to the How to interpret the data page for more information. Small changes in prisoner numbers can cause variations in rates that do not accurately represent either real trends over time or consistent differences from other jurisdictions. Comparisons of rates since 2016 should be used with caution, as the Aboriginal and Torres Strait Islander population estimates are underestimated. Please refer to the How to interpret the data page for more information. |
Future reporting: | Additional disaggregations required for future reporting:
|
Supporting indicators
Driver
- Proportion of Aboriginal and Torres Strait Islander people charged by police
- Proportion of Aboriginal and Torres Strait Islander people convicted and sentenced
By offence and type of sentence
- Aboriginal and Torres Strait Islander prisoner by offence type and number of offences
Most serious and other offences
- Proportion of prisoners by legal status
Sentenced vs unsentenced and by sentence length
- Number and rate of unique alleged offenders processed by police
- Proportion of prisoners previously incarcerated
Number of unique episodes of incarceration
- Mental health, substance abuse issues, family history of incarceration, employment post release, history of victimisation
- Entry rate to incarceration
Newly sentenced to prison
Contextual information
- Rates of death in prison custody of Aboriginal and Torres Strait Islander prisoners
By cause of death
- Proportion spending greater periods of time on remand
- Progress towards parity
Material for download
- Adults are not overrepresented in the criminal justice system data tables (XLSX - 104 Kb)
- Adults are not overrepresented in the criminal justice system dataset (CSV - 192 Kb)
To assist with interpretation of the data provided (Excel data tables and CSV dataset) please refer to the target data specification above.