Target 1
Close the Gap in life expectancy within a generation, by 2031.
Nationally, Aboriginal and Torres Strait Islander males born in 2020–2022 are expected to live to 71.9 years and females to 75.6 years, and non-Indigenous males and females to 80.6 years and 83.8 years respectively (table CtG1A.1).
In 2020–2022 the gap in life expectancy for Aboriginal and Torres Strait Islander males and females was 8.8 years and 8.1 years, respectively. These gaps are lower than estimated in 2005–2007 (11.4 years and 9.6 years), but are higher than the gaps estimated in 2015–2017 (8.7 years and 8.0 years) (figure CtG1.1).
Nationally, based on progress from the baseline, the target shows improvement but is not on track to be met for males or females. However, this assessment should be used with caution as it is based on a limited number of data points. In addition, there have been significant increases in the Aboriginal and Torres Strait Islander population and improvements to identification of Indigenous status in death records, which have contributed to changes in the life expectancy estimates. It is not possible to determine the extent to which population changes and/or improved health outcomes have contributed to changes in the life expectancy estimates. Please refer to the target data specifications and the How to interpret the data page for more information.
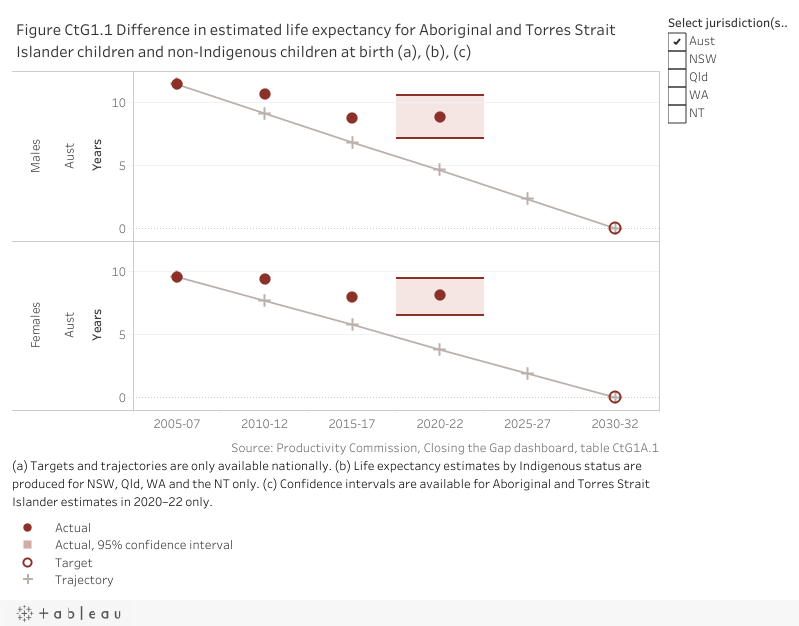
The assessments below reflect progress from the baseline (improvement, worsening or no change). For the national assessment, the target outcome shows improvement but is not on track to be met for males or females.
| Sex | NSW | Vic | Qld | WA | SA | Tas | ACT | NT | Aust | |
|---|---|---|---|---|---|---|---|---|---|---|
| Assessment of progress 2005-07 to 2020-22 | Males |  | Not applicable as required data not available | | | Not applicable as required data not available | Not applicable as required data not available | Not applicable as required data not available | |  |
| Females | | Not applicable as required data not available | | | Not applicable as required data not available | Not applicable as required data not available | Not applicable as required data not available |  | |
improvement  no change worsening not applicable as required data not available.
  good improvement and target on track to be met. improvement but target not on track to be met.
Note: These assessments of progress should be used with caution as they are based on a limited number of data points.
Disaggregations
Data tables appear under figures
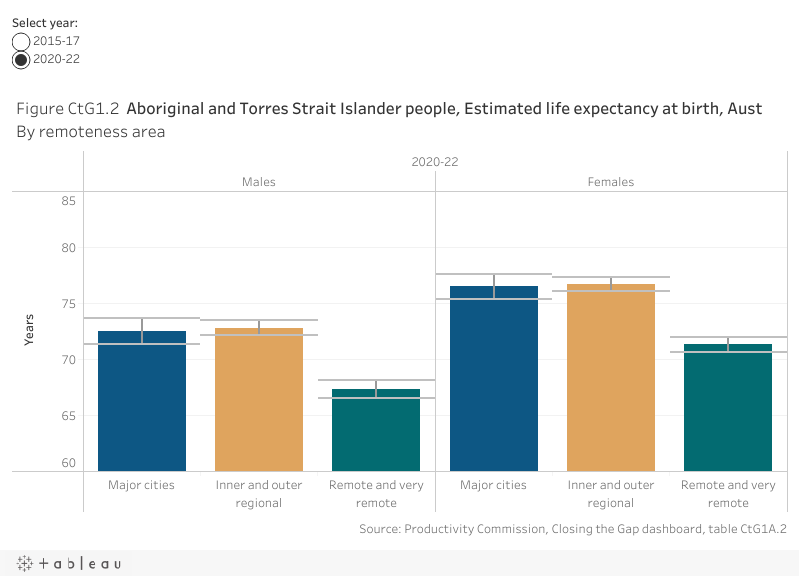
By remoteness area
Nationally, Aboriginal and Torres Strait Islander males and females born in 2020–2022 had higher life expectancy in major cities (72.5 years and 76.5 years, respectively) and regional areas (72.8 years and 76.7 years, respectively), than in remote and very remote areas (combined) (67.3 years and 71.3 years, respectively) (figure CtG1.2).
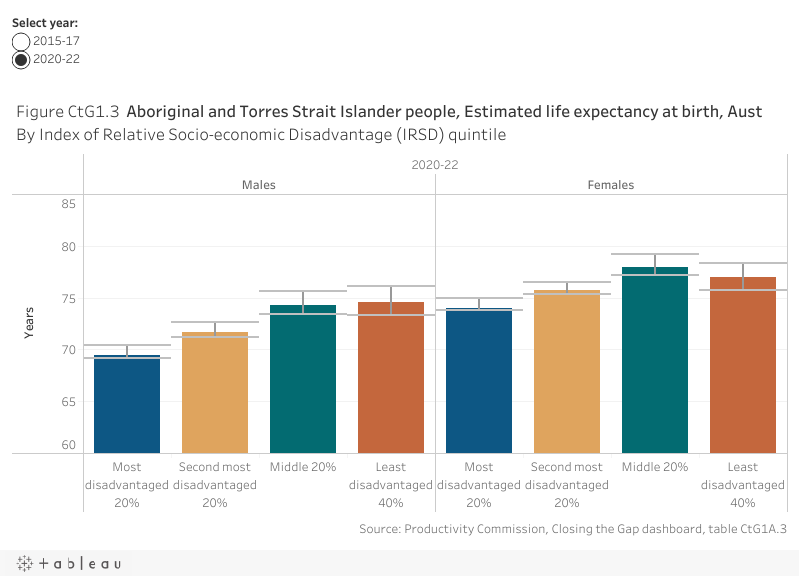
By Index of Relative Socio-economic Disadvantage (IRSD) quintile
Nationally in 2020–2022, Aboriginal and Torres Strait Islander males and females born in the least disadvantaged socio‑economic areas had higher life expectancy (74.6 years and 77.0 years, respectively) compared to those born in the most disadvantaged areas (69.5 years and 74.0 years, respectively) (figure CtG1.3).
Target data specifications
Outcome: | Aboriginal and Torres Strait Islander people enjoy long and healthy lives. |
|---|---|
Target: | Close the Gap in life expectancy within a generation, by 2031. |
Indicator: | Life expectancy gap. |
Measure: | This measure is defined as the difference between Aboriginal and Torres Strait Islander people and non‑Indigenous life expectancy. Life expectancy is the average number of years that a newborn baby could expect to live, if they experienced the age/sex specific death rates that applied at their birth throughout their lifetimes. |
Target established: | National Agreement on Closing the Gap July 2020 |
Latest dashboard update: | 6 March 2024 |
Indicator type: | Target |
Interpretation of change: | A higher or increasing life expectancy for Aboriginal and Torres Strait Islander people and narrowing of the gap in life expectancy with non‑Indigenous people is desirable. |
Data source(s): | Name: ABS Life Tables for Aboriginal and Torres Strait Islander Australians Frequency: Five‑yearly (revised data for 2015–2017 in the March 2024 dashboard update) Documentation (links): https://www.abs.gov.au/statistics/people/aboriginal-and-torres-strait-islander-peoples/life-tables-aboriginal-and-torres-strait-islander-australians/ |
Data provider: | Provider name: Australian Bureau of Statistics Provider area: Demography |
Baseline year: | 2006 (three‑year average of 2005–2007) |
Latest reporting period | 2021 (three‑year average of 2020–2022) |
Target year: | 2031 (three‑year average of 2030–2032) |
Disaggregations: | Selected states and territories and Australia, by Indigenous status, by sex. Australia, by Indigenous status, by remoteness area, by sex. Australia, by Indigenous status, by Index of Relative Socio‑economic Disadvantage (IRSD), by sex. |
Computation: | Counting rules Direct estimation of the life expectancy gap at birth between Aboriginal and Torres Strait Islander and non‑Indigenous people using the average number of deaths registered in the relevant three‑year period and the estimated resident population (ERP) at the mid‑point of that three-year period, with adjustments for incomplete identification by Indigenous status. Life expectancy estimates reported for 2015–2017 and 2020–2022 are calculated taking age-specific identification rates into account. For prior years, life expectancy estimates calculated taking age-specific identification rates into account are only available for the Australian estimates. Therefore, the state and territory estimates should not be compared with the Australian estimates prior to 2015–2017. The Australian total includes all states and territories (including Other Territories). Disaggregations: The data on deaths used to estimate life expectancy at birth by geographic area are based on usual residence of the deceased. Sex relates to biological primary sexual characteristics. Remoteness area is classified according to the ABS Australian Statistical Geography Standard (ASGS) using population data from Statistical Area Level 1 (SA1) regions as the building block. Life expectancy for people whose location of usual residence is either (1) categorised as ‘migratory’ or (2) not sufficient to identify their geographic area and assign remoteness area are excluded from the analysis by remoteness. Socio‑economic status of the locality is classified according to the Socio‑Economic Indexes for Areas (SEIFA): Index of Relative Socio‑economic Disadvantage (IRSD), using population data from SA1 regions as the building block. Data are reported by IRSD quintile that are determined at the Australian level. Life expectancy for people whose location of usual residence is either (1) categorised as ‘migratory’ or (2) not sufficient to identify their geographic area and assign a socio‑economic status of the locality are excluded from the analysis by socio‑economic status. Supporting calculations The difference in life expectancy estimates between Aboriginal and Torres Strait Islander and non‑Indigenous people, and confidence intervals (upper and lower limits). Calculation of differences are based on unrounded estimates. Confidence intervals are only available for the life expectancy estimates of Aboriginal and Torres Strait Islander people and for the difference in life expectancy estimates in 2020–2022. |
Data quality considerations: | Aboriginal and Torres Strait Islander and non-Indigenous life tables are based on ERP (based on the Census of Population and Housing and the Census Post Enumeration Survey), death registration information provided by the State/Territory Registrars of Births, Deaths and Marriages, and the ABS Census Data Enhancement Indigenous Mortality Quality Study. Life expectancy estimates by Indigenous status are produced for New South Wales, Queensland, Western Australia and the Northern Territory only. Aboriginal and Torres Strait Islander estimates of life expectancy are not produced for Victoria, South Australia, Tasmania and the Australia Capital Territory due to the small number of Aboriginal and Torres Strait Islander deaths reported in these jurisdictions. In 2020, the ABS commissioned an independent review to assess the fitness for purpose of the ABS Aboriginal and Torres Strait Islander life expectancy estimation method. Following the review, the ABS implemented changes in the method for the 2020–2022 estimates. These changes are detailed in Updated method for 2020–2022 Aboriginal and Torres Strait Islander life expectancy estimates, which include revised 2015–2017 estimates using the updated methodology. Caution is required when interpreting trends in life expectancy estimates. The ABS does not compare Aboriginal and Torres Strait Islander life expectancy estimates over time. There have been significant increases in the Aboriginal and Torres Strait Islander population between Censuses since 2006, and improvements to identification of Indigenous status in death records. It is not possible to determine the extent to which population changes and/or improved health outcomes have contributed to changes in the life expectancy estimates. |
Future reporting: | Additional disaggregations required for future reporting:
|
Supporting indicators
Driver
- All-cause mortality
- Leading causes of death
Infant mortality, child mortality, and five-yearly age groups
- Potential avoidable mortality rates
- Prevalence rates of health risk factors
Smoking, alcohol and drug use, overweight and obese, dietary factors, physical activity
- Rates of accessing/utilisation of health services
General Practitioner (GP) visits, health assessments (Medicare Benefit 715), chronic disease care items (Team Care arrangement and GP Management Plan)
Contextual information
- Hospitalisation rates by leading causes
- Discharge against medical advice
- Burden of disease from socioeconomic factors
Material for download
- People enjoy long and healthy lives data tables (XLSX - 164 Kb)
- People enjoy long and healthy lives dataset (CSV - 574 Kb)
To assist with interpretation of the data provided (Excel data tables and CSV dataset) please refer to the target data specification above.