Target 9A
By 2031, increase the proportion of Aboriginal and Torres Strait Islander people living in appropriately sized (not overcrowded) housing to 88%.
Target 9B
By 2031, all Aboriginal and Torres Strait Islander households:- within discrete Aboriginal or Torres Strait Islander communities receive essential services that meet or exceed the relevant jurisdictional standard
- in or near to a town receive essential services that meet or exceed the same standard as applies generally within the town (including if the household might be classified for other purposes as a part of a discrete settlement such as a “town camp” or “town based reserve”).
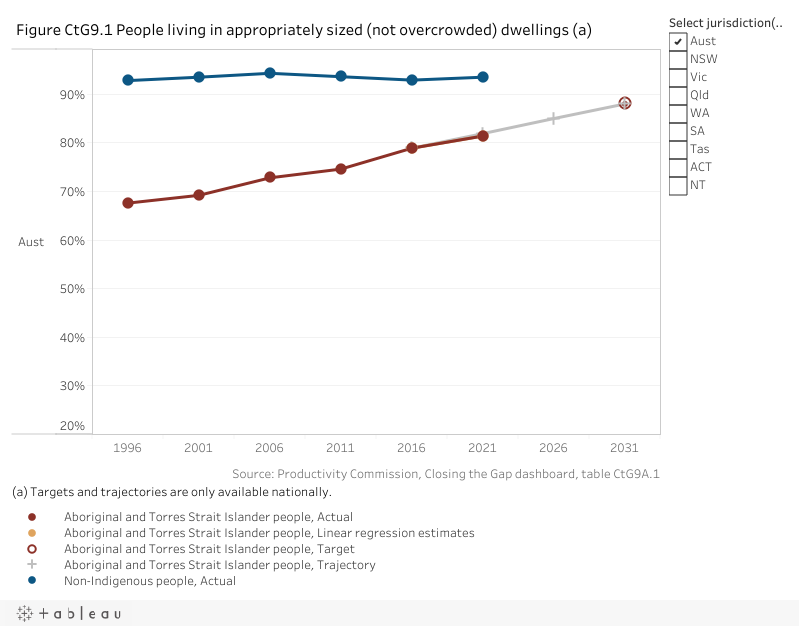
Nationally in 2021, 81.4% of Aboriginal and Torres Strait Islander people were living in appropriately sized (not overcrowded) housing (figure CtG9.1).
This is an increase from 78.9% in 2016 (the baseline year).
Nationally, based on progress from the baseline, target 9A shows improvement but is not on track to be met. However, this assessment should be used with caution as it is based on a limited number of data points. Please refer to the How to interpret the data page for more information.
Target 9B is not able to be reported against as there is no data source currently available which includes all required data elements.
The assessments below reflect progress from the baseline (improvement, worsening or no change). For the national assessment, the target 9A outcome shows improvement but is not on track to be met.
| Appropriate housing | NSW | Vic | Qld | WA | SA | Tas | ACT | NT | Aust |
|---|---|---|---|---|---|---|---|---|---|
| Assessment of progress 2016 to 2021 |  | | | | |  | | |  |
improvement  no change worsening not applicable as required data not available.
  good improvement and target on track to be met. improvement but target not on track to be met.
Note: These assessments of progress should be used with caution as they are based on a limited number of data points.
Disaggregations
Data tables appear under figures
By sex
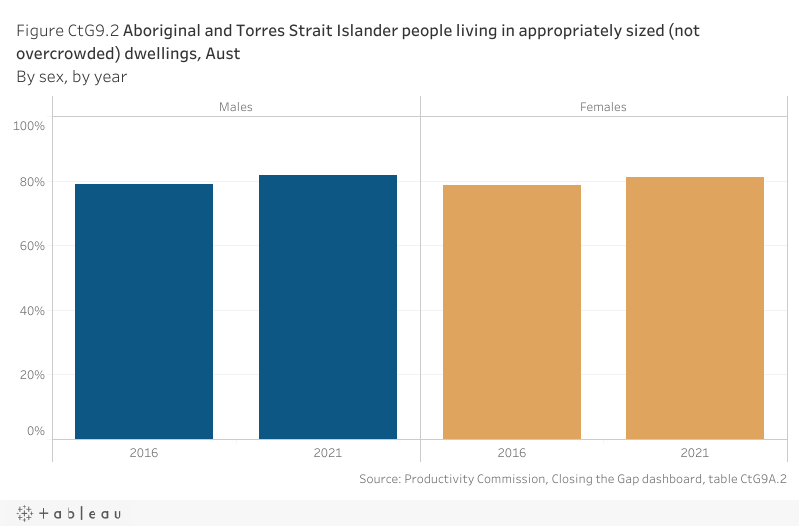
Nationally in 2021, a higher proportion of Aboriginal and Torres Strait Islander males were living in appropriately sized (not overcrowded) housing (81.8%) compared to females (81.1%) (figure CtG9.2). The proportions increased by around three percentage points for males and around two percentage points for females since the 2016 baseline year.
By age group
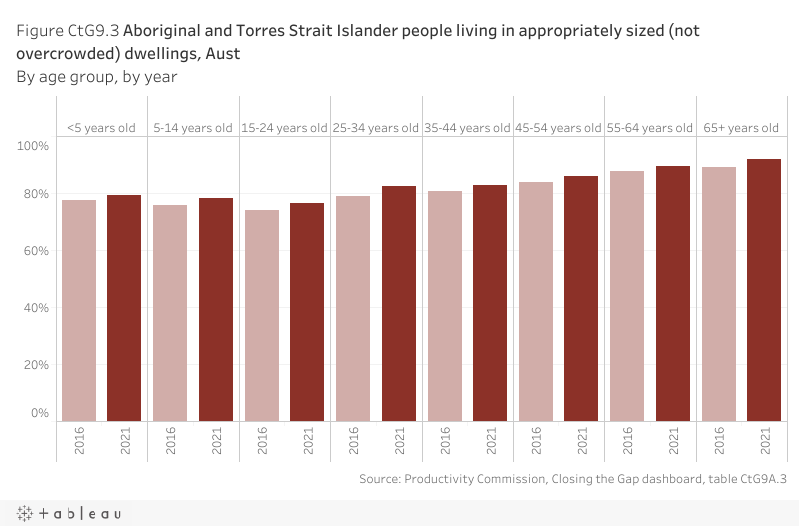
Nationally in 2021, the proportion of Aboriginal and Torres Strait Islander people who were living in appropriately sized (not overcrowded) housing was highest for people aged 65 years and over (91.8%). The proportion was lower for younger age groups and was lowest for people aged 15-24 years (76.6%) (figure CtG9.3). This follows a similar pattern to the 2016 baseline year. Nationally from 2016 to 2021, there was an increase of two to three percentage points for people living in appropriately sized housing across all age groups.
By remoteness area
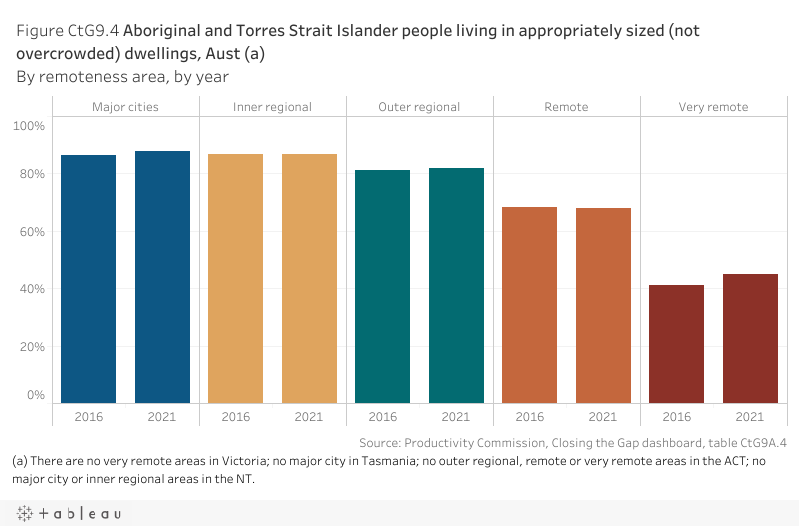
Nationally in 2021, the proportion of Aboriginal and Torres Strait Islander people who were living in appropriately sized (not overcrowded) housing was highest in major cities (87.8%) (figure CtG9.4). The proportions declined as remoteness increased, down to 45.0% for people living in very remote areas. Since the 2016 baseline year, the proportions increased for people in major cities, outer regional areas and very remote areas, but did not change for people living in inner regional areas and decreased (less than one percentage point) for people living in remote areas.
By Index of Relative Socio-economic Disadvantage (IRSD) quintile
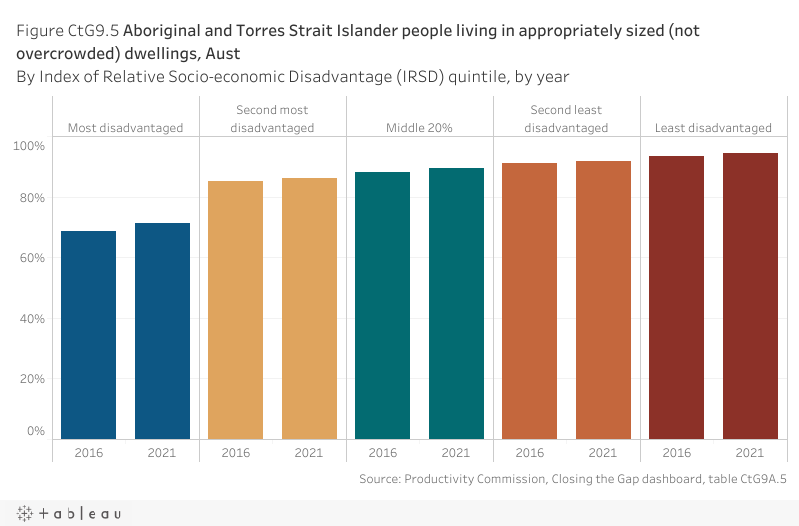
Nationally in 2021, the proportion of Aboriginal and Torres Strait Islander people who were living in appropriately sized (not overcrowded) housing was highest in the least disadvantaged socio-economic areas of Australia (94.5%) (figure CtG9.5). The proportion declined in more disadvantaged areas, down to 71.4% for people living in the most disadvantaged socio-economic areas of Australia. The proportions have increased in all socio-economic areas since the 2016 baseline year.
By disability status
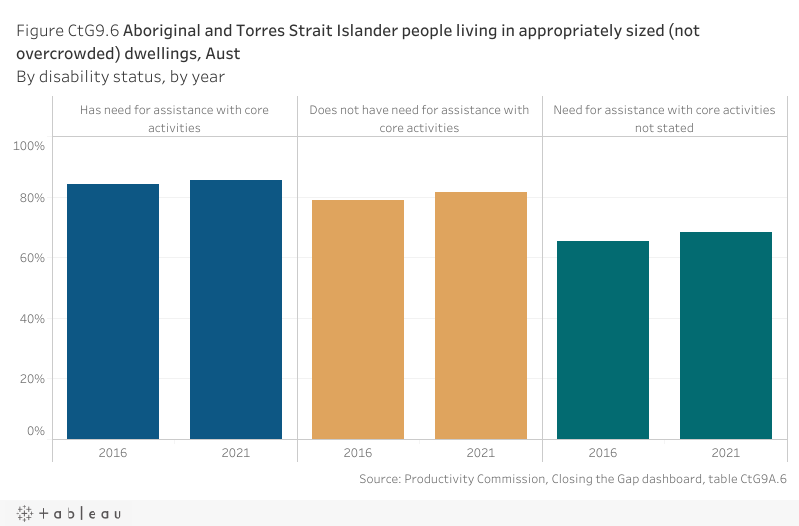
Nationally in 2021, a higher proportion of Aboriginal and Torres Strait Islander people with a need for assistance with core activities were living in appropriately sized (not overcrowded) housing (85.5%) compared to people who do not have a need for assistance (81.4%) (figure CtG9.6). The proportions increased by around one percentage point for people with a need for assistance with core activities and increased by around three percentage points for people who do not have a need for assistance, since the 2016 baseline year.
By number of extra bedrooms needed
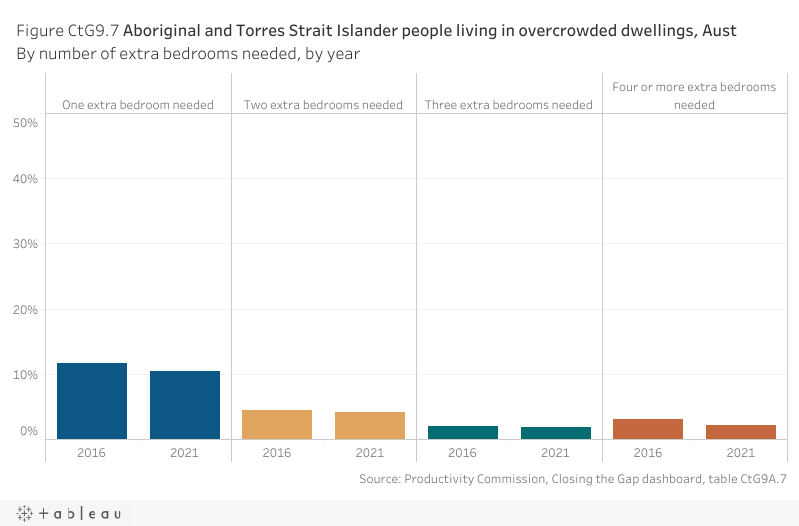
Nationally in 2021, 18.6% of Aboriginal and Torres Strait Islander people lived in overcrowded dwellings (i.e. dwellings requiring one or more extra bedrooms), a decrease of around three percentage points since the 2016 baseline. Most Aboriginal and Torres Strait Islander people that lived in overcrowded dwellings in 2021 lived in a dwelling that required one extra bedroom (10.5% of people), while 4.1% of people required two extra bedrooms, 1.8% required three extra bedrooms and 2.1% lived in a dwelling that required four or more extra bedrooms (figure CtG9.7).
By tenure type
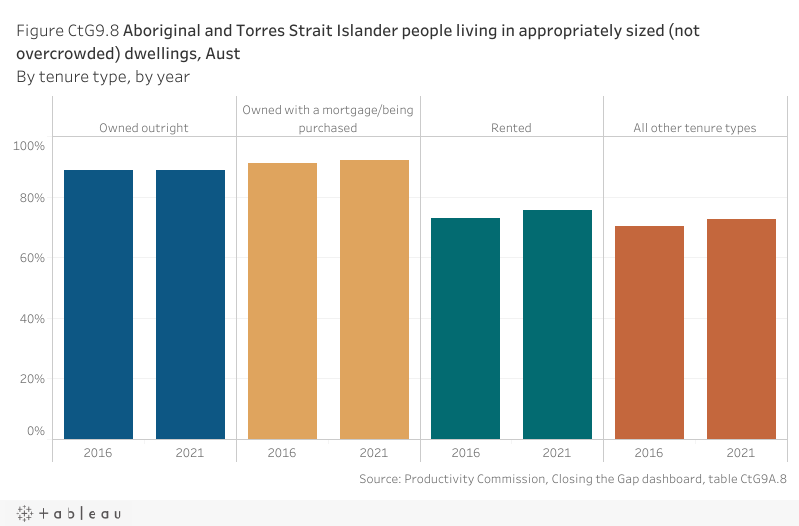
Nationally in 2021, a higher proportion of Aboriginal and Torres Strait Islander people lived in appropriately sized dwellings if they were owned outright or owned with a mortgage (88.9% and 92.1%, respectively) than if they lived in rented dwellings or other tenure types (75.5% and 72.5%, respectively). Since 2016, there was an increase in Aboriginal and Torres Strait Islander people living in appropriately sized housing across all tenure types (figure CtG9.8).
Target data specifications
Outcome: | Aboriginal and Torres Strait Islander people secure appropriate, affordable housing that is aligned with their priorities and need. |
|---|---|
Target: | Target 9A: By 2031, increase the proportion of Aboriginal and Torres Strait Islander people living in appropriately sized (not overcrowded) housing to 88%. Target 9B: By 2031, all Aboriginal and Torres Strait Islander households:
|
Indicator: | Target 9A The proportion of Aboriginal and Torres Strait Islander people living in appropriately sized (not overcrowded) housing. Target 9B The proportion of Aboriginal and Torres Strait Islander households receiving essential services that meet or exceed standards |
Measure: | Target 9A The measure is defined as: Numerator – number of Aboriginal and Torres Strait Islander people living in appropriately sized (not overcrowded) dwellings Denominator – total number of Aboriginal and Torres Strait Islander people and is presented as a percentage. Target 9B The indicator has two measures. Measure 1 is the proportion of Aboriginal and Torres Strait Islander households within discrete Indigenous communities that meet or exceed the relevant jurisdictional standard Numerator – number of Aboriginal and Torres Strait Islander households within discrete Indigenous communities that meet or exceed the relevant jurisdictional standard Denominator – number of Aboriginal and Torres Strait Islander households within discrete Indigenous communities and is presented as a percentage Measure 2 is the proportion of Aboriginal and Torres Strait Islander households in or near to a town that receive essential services that meet or exceed the same standard as applies generally within the town Numerator – number of Aboriginal and Torres Strait Islander households in or near to a town that receive essential services that meet or exceed the same standard as applies generally within the town Denominator – number of Aboriginal and Torres Strait Islander households in or near to a town and is presented as a percentage |
Target established: | National Agreement on Closing the Gap July 2020; target 9B added August 2022 |
Latest dashboard update: | 15 June 2023 |
Indicator type: | Target |
Interpretation of change: | For all measures, a high or increasing proportion is desirable. |
Data source(s): | Target 9A Name: Census of Population and Housing Frequency: Five‑yearly Documentation (links): https://www.abs.gov.au/census Target 9B To be confirmed. There is no data source currently available which includes all required data elements to enable reporting against this target. |
Data provider: | Target 9A Provider name: Australian Bureau of Statistics (ABS) Provider area: Census Target 9B To be confirmed. |
Baseline year: | Target 9A 2016 Target 9B To be confirmed. |
Latest reporting period: | Target 9A 2021 Target 9B To be confirmed. |
Target year: | Targets 9A and 9B 2031 |
Disaggregations: | Target 9A State and territory and Australia, by Indigenous status. State and territory and Australia, by Indigenous status, by sex. State and territory and Australia, by Indigenous status, by remoteness area. State and territory and Australia, by Indigenous status, by Index of Relative Socio‑economic Disadvantage (IRSD) quintile. State and territory and Australia, by Indigenous status, by disability status. State and territory and Australia, by age. State and territory and Australia, by Indigenous status, by number of extra bedrooms needed. State and territory and Australia, by Indigenous status, by tenure type. Target 9B To be confirmed. |
Computation: | Target 9A Numerator divided by Denominator multiplied by 100. Counting rules The data is for people enumerated in private dwellings who reported being ‘at home’ on Census night. Geographical variables are based on a person's Place of Enumeration (location on Census night). Numerator Appropriately sized dwellings are those where no extra bedrooms are required to adequately house the usual residents, using the criteria of the Canadian National Occupancy Standard (CNOS). The CNOS specifies that:
The CNOS requires knowledge of the age, sex and relationship status of all tenants within a household, as well as the number of bedrooms in the dwelling. Households for which complete dwelling utilisation information is not available are excluded from this measure. Includes (numerator and denominator):
Excludes (numerator and denominator):
Disaggregations: Sex refers to a person’s biological characteristics. The 2021 Census allowed all respondents to select from three response options for the sex question: male, female and non‑binary sex. Where a respondent has provided a male or female response and a non‑binary sex response, the male or female response was used to determine a binary sex variable. Otherwise, sex was derived by a statistical process using random allocation. Remoteness area is classified according to the ABS Australian Statistical Geography Standard (ASGS) using SA1 as the building block. For people with incomplete/invalid or missing address information, the ABS imputes the place of usual residence. The non‑response rate at the SA1 level was 4.4% in 2021. Remoteness area disaggregations exclude ‘Migratory – Offshore – Shipping’ and ‘No usual address’. Please see the How to interpret the data page for more information. Socio‑economic status of the locality is classified according to the ABS Socio‑Economic Indexes for Areas (SEIFA): Index of Relative Socio‑economic Disadvantage (IRSD), using SA1 as the building block. For people with incomplete/invalid or missing address information, the ABS will impute the place of usual residence. The data is reported by IRSD quintile, which is determined at the Australian level and excludes persons with unknown or unavailable SEIFA score. Some individual geographic areas were excluded from SEIFA for various reasons, such as low population or high non‑response to certain Census questions. Please see the How to interpret the data page for more information. Disability is classified according to core activity need for assistance. The data is only available for people with a profound or severe core activity limitation. Disability data sourced from the Census is based on four questions to identify need for assistance and may not be fully comparable with data from other sources. See www.abs.gov.au/ausstats/abs@.nsf/mf/4431.0.55.002 for more information. (Data for people whose ‘need for assistance with core activities’ was not stated is provided for context.) Age is derived from a person’s date of birth. If date of birth is not stated, an age value is imputed by the ABS. Number of extra bedrooms needed is classified according to the CNOS. Data are reported for dwellings requiring one, two, three and four or more extra bedrooms to be considered appropriately sized to adequately house the residents. Tenure type describes whether a dwelling is owned, owned with a mortgage/being purchased (includes ‘owned with a mortgage’ and ‘being purchased under a share equity scheme’), rented, or all other tenure types (includes ‘being occupied rent free’, ‘being occupied under a life tenure scheme’, ‘other tenure type' and ‘not stated’). Extraction Census TableBuilder Pro Counting Persons, Place of Enumeration database HOSD x INGP x Main ASGS (EN) x UAICP [Disaggregations: SEXP; REMOTE (UR); IRSD; ASSNP; AGE5P; TEND]. Target 9B The definition of a discrete community from ABS 2016 Census dictionary: A discrete community is a geographic location, bounded by physical or legal boundaries, which is inhabited or intended to be inhabited predominantly (i.e. greater than 50% of usual residents) by Aboriginal or Torres Strait Islander peoples, with housing or infrastructure (power, water, sewerage) that is managed on a community basis. Discrete communities have populations of (but not limited to) 50% or more Aboriginal and Torres Strait Islander people. Essential services include: power, water, wastewater and solid waste management only. Relevant jurisdictional standard: Applicable standards may differ between places within a jurisdiction according to population size or other relevant criteria but not on criteria linked to the settlement’s status as a discrete Aboriginal or Torres Strait Islander community. |
Data quality considerations: | Target 9A All data values have been randomly adjusted using perturbation to avoid the release of confidential data. Proportions/rates calculated for small populations should be used with caution. There is no universally accepted definition of what constitutes an overcrowded household. The ABS uses the CNOS. The CNOS is widely used in Australia and internationally. The relevance and appropriateness of CNOS in depicting dwelling utilisation for Aboriginal and Torres Strait Islander people has not been assessed. Classification of ‘Levels of overcrowding specific to Australian conditions’ is to be considered under the Data Development Plan endorsed by the Joint Council on Closing the Gap in August 2022. Target 9B To be confirmed. |
Future reporting: | Target 9A Additional disaggregations required for future reporting:
|
Supporting indicators
Driver
- Change in population by location
- Change in social housing dwellings by location
Contextual information
- Home ownership rate
Including by location and tenure type
- Homelessness rate including by type and age group
e.g. Transitional housing/sleeping rough
- Structural problems including functional health hardware
Australian Bureau of Statistics (ABS) measure of acceptable standard of housing
- Low income household experiencing rental stress/mortgage stress
- Social housing dwellings per 100 households by location
- Progress towards parity
- Rate of Rheumatic Heart Disease (RHD) diagnoses
By severity at diagnosis
- Hospitalisation rates for environmentally based diseases
- Mortality rates for diseases associated with poor environmental health
Material for download
- People secure appropriate, affordable housing that is aligned with their priorities and need data tables (XLSX - 85 Kb)
- People secure appropriate, affordable housing that is aligned with their priorities and need dataset (CSV - 129 Kb)
To assist with interpretation of the data provided (Excel data tables and CSV dataset) please refer to the target data specification above.