Target 11
By 2031, reduce the rate of Aboriginal and Torres Strait Islander young people (10–17 years) in detention by at least 30%.
Nationally in 2022-23, the rate of Aboriginal and Torres Strait Islander young people aged 10–17 years in detention on an average day was 29.8 per 10,000 young people in the population (figure CtG11.1).
The 2022‑23 rate is above the previous three years (from a low of 23.6 per 10,000 young people in 2020‑21) but it is a decrease from 32.1 per 10,000 young people in 2018‑19 (the baseline year).
Nationally, the trend for the target shows no change from the baseline. This assessment is provided with a low level of confidence. Please refer to the How to interpret the data page for more information.
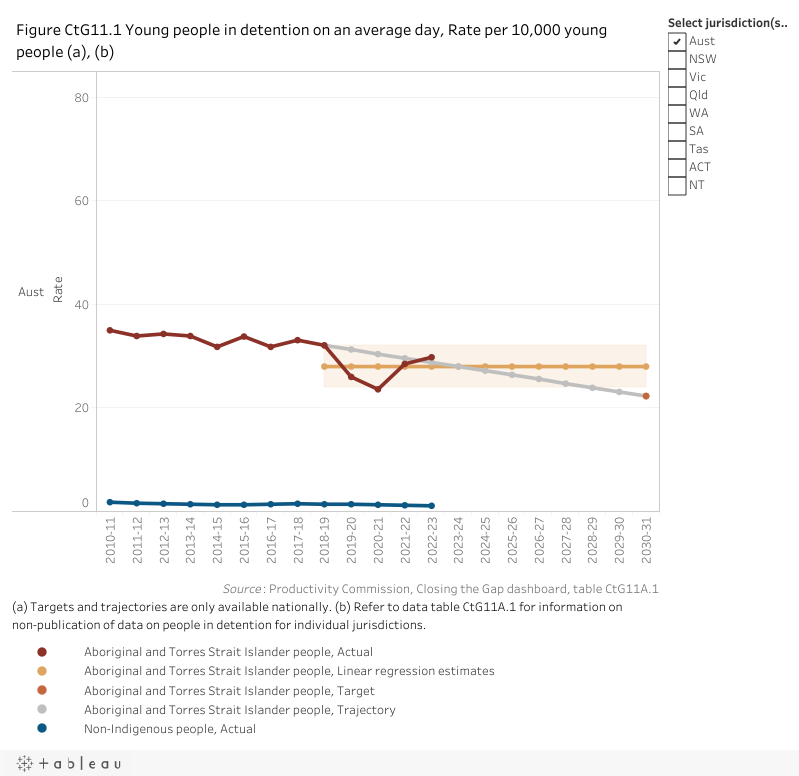
The assessment below reflects progress from the baseline (improvement, worsening or no change). For the national assessment, the target outcome shows no change.
| NSW | Vic | Qld | WA | SA | Tas | ACT | NT | Aust | |
|---|---|---|---|---|---|---|---|---|---|
| Assessment of progress 2018-19 to 2022-23 |  | |  | | | | | |  |
| Confidence level | Low | High | Low | High | High | Low | Low | High | Low |
improvement no change worsening not applicable as required data not available.  good improvement and target on track to be met.
  improvement but target not on track to be met.
Note: These assessments of progress are provided with a 'High' or 'Low' level of confidence. An assessment reported with a High level of confidence is considered to be more reliable than one reported with a Low level of confidence. Please see the 'How to interpret the data' page for more information.
Disaggregations
Data tables appear under figures
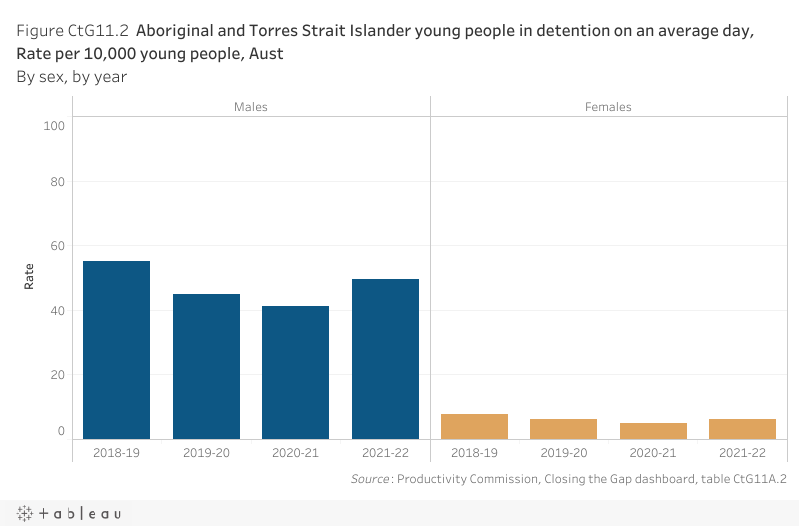
By sex
Nationally in 2021-22, the rate of Aboriginal and Torres Strait Islander males aged 10–17 years in detention on an average day was 49.4 per 10,000 young people in the population compared to 6.3 per 10,000 for Aboriginal and Torres Strait Islander females of the same age. The 2021‑22 detention rates for both males and females are above the previous year but, have decreased since the baseline year of 2018-19 (figure CtG11.2).
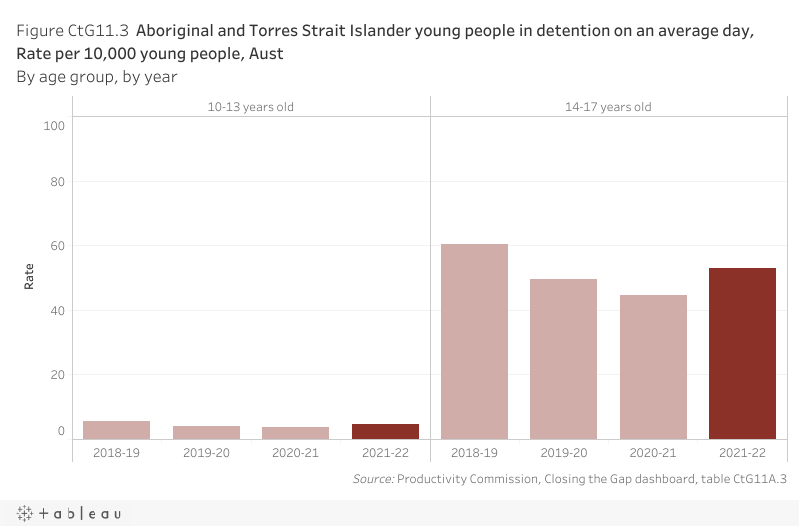
By age group
Nationally in 2021-22, the rate of Aboriginal and Torres Strait Islander young people aged 14–17 years in detention on an average day (53.0 per 10,000) was higher than the rate for young people aged 10–13 years (4.5 per 10,000). The 2021‑22 detention rates for each age group are above the previous year but have decreased since the baseline year of 2018‑19 (figure CtG11.3).
By sex, by age group
Data on the average daily number of Aboriginal and Torres Strait Islander young people in detention, by sex, by age group is available in table CtG11A.4 .
Target data specifications
Outcome: | Aboriginal and Torres Strait Islander young people are not overrepresented in the criminal justice system. |
|---|---|
Target: | By 2031, reduce the rate of Aboriginal and Torres Strait Islander young people (10–17 years) in detention by at least 30%. |
Indicator: | The rate of Aboriginal and Torres Strait Islander young people aged 10–17 years in detention. |
Measure: | This measure is defined as: Numerator – average daily number of Aboriginal and Torres Strait Islander young people aged 10–17 years in supervised youth detention Denominator – number of Aboriginal and Torres Strait Islander people aged 10–17 years in the population and is presented as a rate per 10,000 young people. |
Target established: | National Agreement on Closing the Gap July 2020 |
Latest dashboard update: | 15 June 2023 |
Indicator type: | Target |
Interpretation of change: | A low or decreasing rate is desirable. |
Data source(s): | Name (numerator): Youth Justice National Minimum Dataset (YJ NMDS) Frequency: Annual Name (denominator): Estimates and Projections for Aboriginal and Torres Strait Islander population Frequency: Annual (revised data for 2010‑11 to 2021‑22 in the March 2024 dashboard update) Documentation (links): https://www.aihw.gov.au/reports-data/health-welfare-services/youth-justice |
Data provider: | Provider name (numerator): Australian Institute of Health and Welfare Provider area: Youth justice Provider name (denominator): Australian Bureau of Statistics (ABS) Provider area: Demography |
Baseline year: | 2018‑19 |
Latest reporting period: | 2022‑23 (target) 2021‑22 (target disaggregations) |
Target year: | 2030‑31 |
Disaggregations: | State and territory and Australia, by Indigenous status. State and territory and Australia, by Indigenous status, by sex. State and territory and Australia, by Indigenous status, by age group. State and territory and Australia, by Indigenous status, by sex, by age group. |
Computation: | Numerator divided by Denominator multiplied by 10,000. Counting rules Average daily numbers are calculated by summing the number of days each young person spends under supervision during the year (irrespective of age) and dividing this total by the number of days in the same year. Age is calculated based on the age a young person is each day that they are under supervision. If a young person changes age during a period of supervision, then the average daily number under supervision will reflect this. The numerator is calculated by summing the number of days each young person spends in detention during the financial year and dividing this total by the number of days in the financial year reporting period. Number of young people on an average day may not sum to total due to rounding. Rates are calculated from unrounded numbers of young people on an average day. Includes (numerator):
Excludes (numerator):
Denominator:
Disaggregations: Sex refers to a young person's biological characteristics at birth. A person's sex is usually described as being either male or female, but may be recorded as ‘other’. See Person—sex, code X (aihw.gov.au) Age is based on date of birth where known but can also be collect directly or estimated. Children with unknown age are excluded from the analysis by age. |
Data quality considerations: | Data by Indigenous status are influenced by the quality of Aboriginal and Torres Strait Islander identification of young people in the YJ NMDS. About 5% of all young people in the YJ NMDS since 2000‑01 have an unknown Indigenous status. In 2021‑22, about 2% of all young people under supervision during the year had an unknown Indigenous status. Among the states and territories, this ranged from less than 1% in Victoria, Queensland, South Australia and the Australian Capital Territory to 6% in New South Wales. Western Australia had no unknown Indigenous status. Rates are calculated by the PC using updated population data and may differ from data published in the AIHW publication, Youth Justice in Australia 2021‑22. For results derived using small numbers, year-on-year movements in the results should be interpreted with caution. Please refer to the How to interpret the data page for more information. While the scope of this target is youth aged 10–17 years, additional data have been provided for all people in detention (including those aged 18 years or over) for context. Rates for the age range 18 years or over have not been calculated as most people in the age range are under adult justice supervision. Youth detention numbers are provided by sex, by age group (10–13 years, 14–17 years and 18 years or over age groups). Comparisons of rates since 2016 should be used with caution, as the Aboriginal and Torres Strait Islander population estimates are underestimated. Please refer to the How to interpret the data page for more information. |
Future reporting: | Additional disaggregations required for future reporting:
|
Supporting indicators
Driver
- Un-sentenced detention rates
- Average time in detention for unsentenced youth
- Proportion of young alleged offenders (10–17 years) involved in police proceedings
Including charges and summons, cautions, diversions
- Proportion of young people convicted and sentenced
By type of sentence (community supervision, detention)
- Entrant rate to detention
Newly sentenced to youth detention
- Proportion of youth under community supervision transitioning to detention
- Young people returning to detention or community supervision
- Proportion of young people first coming into youth justice system aged 10-13
Offending and courts data, first entry to detention
Contextual information
- Community supervision trends
Proportion of young people in detention who had received child protection services (including out-of-home care)
- Proportion exiting detention
By reason
- Progress towards parity
Material for download
- Young people are not overrepresented in the criminal justice system data tables (XLSX - 81 Kb)
- Young people are not overrepresented in the criminal justice system dataset (CSV - 135 Kb)
To assist with interpretation of the data provided (Excel data tables and CSV dataset) please refer to the target data specification above.