Target 7
By 2031, increase the proportion of Aboriginal and Torres Strait Islander youth (15-24 years) who are in employment, education or training to 67%.
Nationally in 2021, 58.0% of Aboriginal and Torres Strait Islander people aged 15–24 years were fully engaged in employment, education or training (figure CtG7.1).
This is an increase from 57.2% in 2016 (the baseline year).
Nationally, based on progress from the baseline, the target shows improvement but is not on track to be met. However, this assessment should be used with caution as it is based on a limited number of data points. Please see the How to interpret the data page for more information.
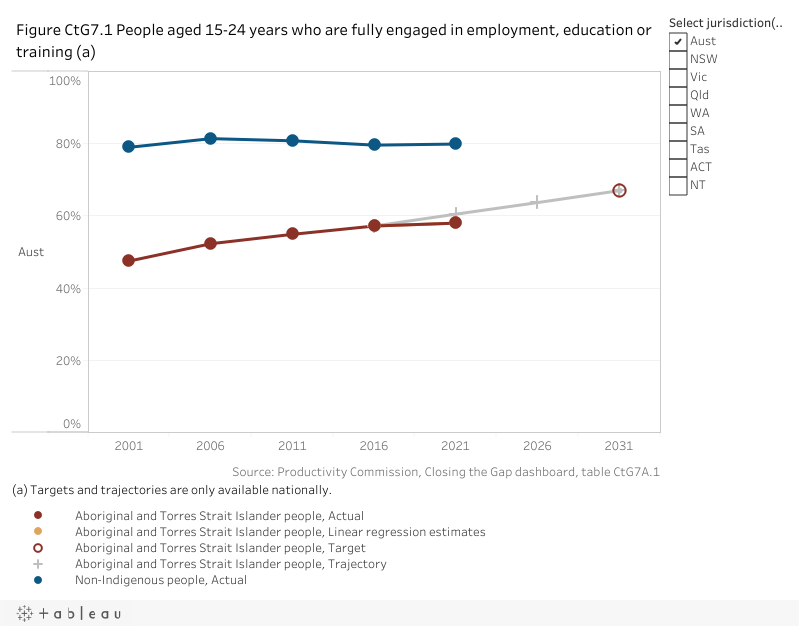
The assessment below reflects progress from the baseline (improvement, worsening or no change). For the national assessment, the target outcome shows improvement but is not on track to be met.
| NSW | Vic | Qld | WA | SA | Tas | ACT | NT | Aust | |
|---|---|---|---|---|---|---|---|---|---|
| Assessment of progress 2016 to 2021 |  | | | |  | | | |  |
improvement  no change worsening not applicable as required data not available.
  good improvement and target on track to be met. improvement but target not on track to be met.
Note: These assessments of progress should be used with caution as they are based on a limited number of data points.
Disaggregations
Data tables appear under figures
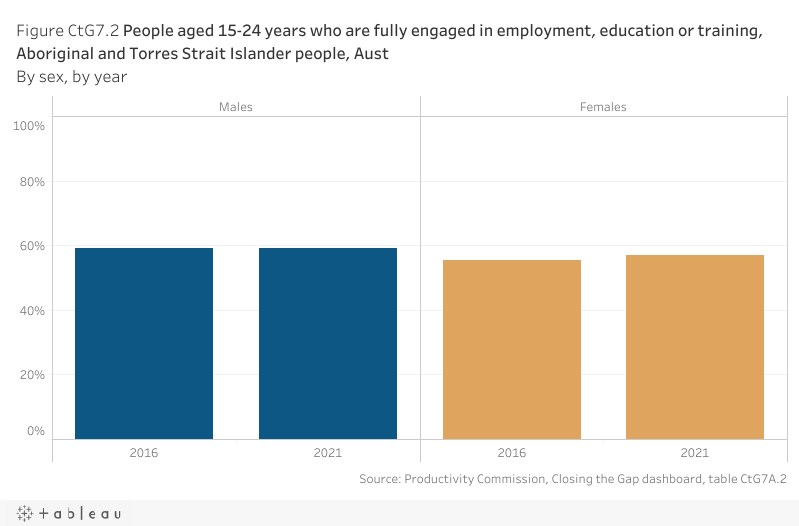
By sex
Nationally in 2021, a higher proportion of Aboriginal and Torres Strait Islander males aged 15–24 years were fully engaged in employment, education or training (59.2%) compared to females (56.9%) (figure CtG7.2). The proportions increased by less than one percentage point for males and around two percentage point for females since the 2016 baseline year.
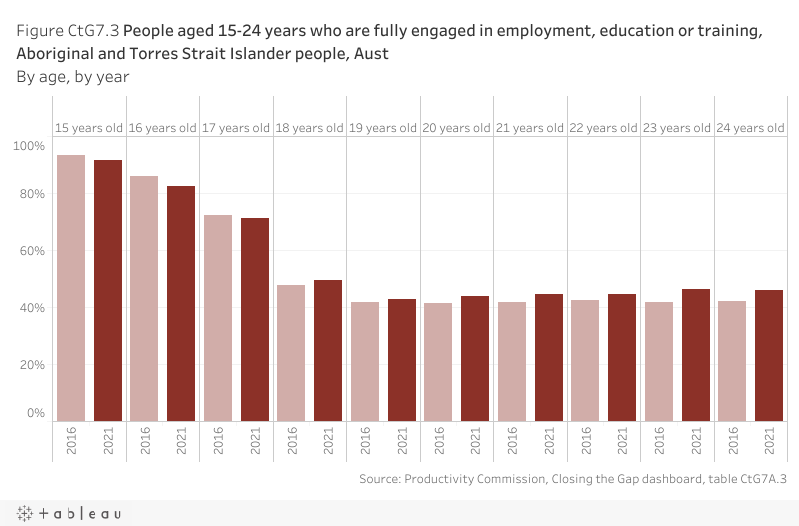
By age
Nationally in 2021, the proportion of Aboriginal and Torres Strait Islander people fully engaged in employment, education or training was highest for people aged 15 years (91.5%). This rate declined for each year of age up to people aged 19 years (42.9%) before increasing slightly for people aged 20 to 24 years (ranging between 43.8 and 46.2%) (figure CtG7.3). This follows a similar pattern to the 2016 baseline year. While engagement rates remain higher for younger people, nationally between 2016 and 2021 saw a shift across the ages. The rate declined between one and three percentage points for people aged 15 to 17 years and increased between one and three percentage points for people aged 18 to 24 years.
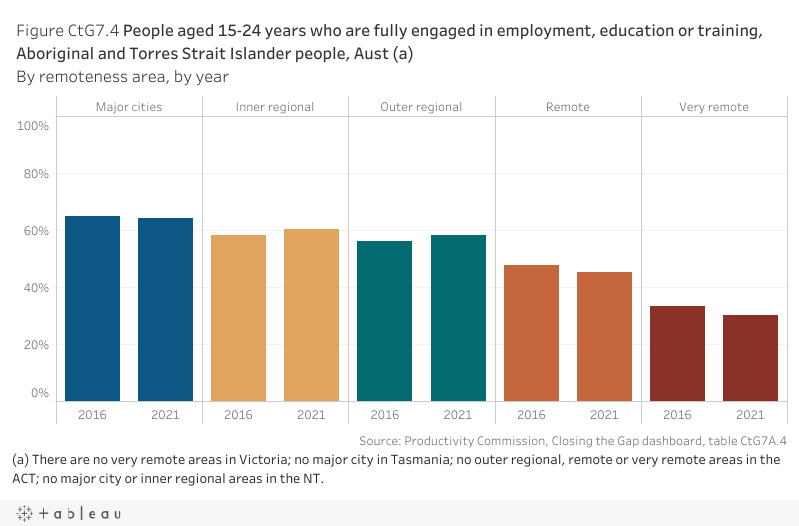
By remoteness area
Nationally in 2021, the proportion of Aboriginal and Torres Strait Islander people aged 15–24 years who were fully engaged in employment, education or training was highest in major cities (64.1%) (figure CtG7.4). The proportions declined as remoteness increased, down to 30.2% for people living in very remote areas. Since the 2016 baseline year, the proportions have increased for people living in inner regional and outer regional areas, but decreased in major cities, remote and very remote areas.
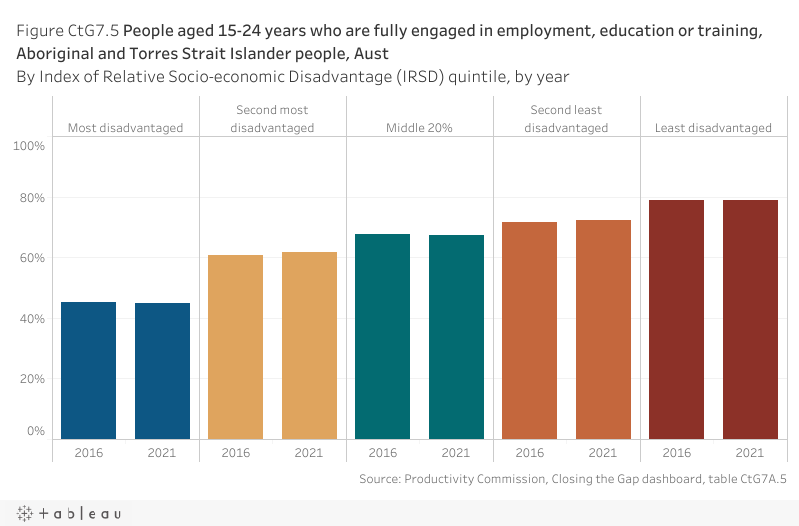
By Index of Relative Socio-economic Disadvantage (IRSD) quintile
Nationally in 2021, the proportion of Aboriginal and Torres Strait Islander people aged 15–24 years who were fully engaged in employment, education or training was highest in the least disadvantaged socio‑economic areas of Australia (79.0%) (figure CtG7.5). The proportions declined in more disadvantaged areas, down to 44.9% for people living in the most disadvantaged socio‑economic areas of Australia. Since the 2016 baseline year, the proportions increased for people living in the second most disadvantaged areas and the second least disadvantaged areas, but remained the same or decreased in the other socio‑economic areas (all movements were within one percentage point).
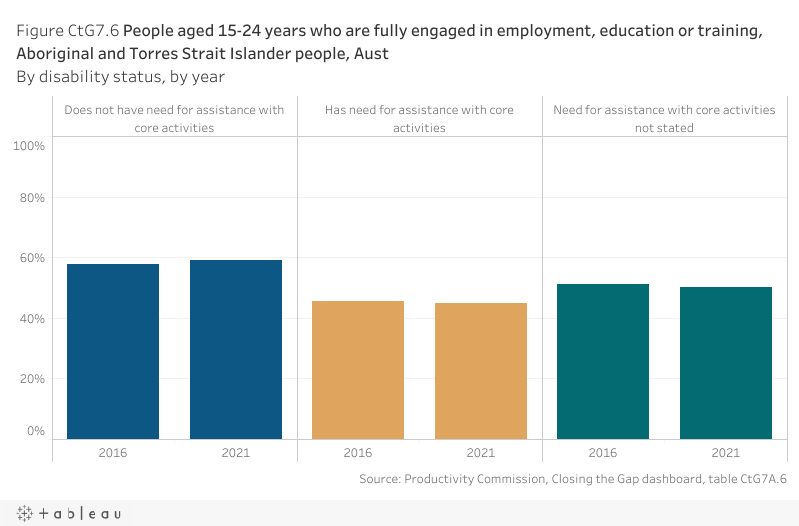
By disability status
Nationally in 2021, a lower proportion of Aboriginal and Torres Strait Islander people aged 15–24 years with a need for assistance with core activities were fully engaged in employment, education or training (44.8%) compared to people who do not have a need for assistance (59.0%) (figure CtG7.6). The proportions decreased by around one percentage point for people with a need for assistance with core activities and increased by around one percentage point for people who do not have a need for assistance, since the 2016 baseline year.
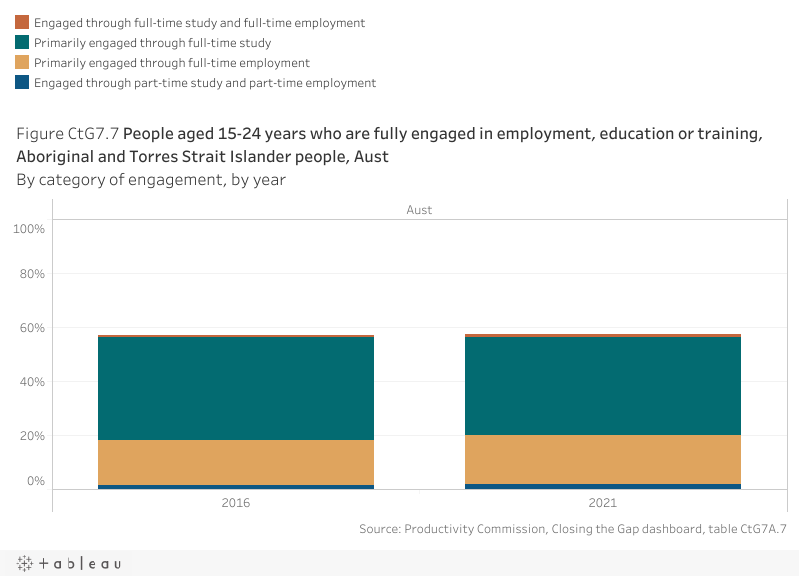
By category of engagement
Nationally in 2021, the proportion of Aboriginal and Torres Strait Islander people aged 15–24 years who were fully engaged was mainly driven by people who were engaged through full‑time study (36.4%, a decrease of around two percentage point since the 2016 baseline), followed by people engaged in full‑time employment (18.1%, an increase of around one percentage point since the 2016 baseline). Less than one percentage point of people were involved in a combination of full‑time study and full‑time employment (1.2%) or a combination of part‑time study and part‑time employment (1.8%) (figure CtG7.7).
Target data specifications
Outcome: | Aboriginal and Torres Strait Islander youth are engaged in employment or education. |
|---|---|
Target: | By 2031, increase the proportion of Aboriginal and Torres Strait Islander youth (15–24 years) who are in employment, education or training to 67%. |
Indicator: | The proportion of Aboriginal and Torres Strait Islander youth aged 15–24 years who are fully engaged in employment, education or training. |
Measure: | The measure is defined as: Numerator – number of Aboriginal and Torres Strait Islander people aged 15–24 years who are engaged in full‑time work, full‑time study and/or full‑time training or a combination of work and study and training Denominator – total number of Aboriginal and Torres Strait Islander people in the population aged 15–24 years old and is presented as a percentage. |
Target established: | National Agreement on Closing the Gap July 2020 |
Latest dashboard update: | 15 June 2023 |
Indicator type: | Target |
Interpretation of change: | A high or increasing proportion is desirable. |
Data source: | Name: ABS Census of Population and Housing, Census Table Builder (Basic) Frequency: Five‑yearly Documentation (links): www.abs.gov.au/census |
Data provider: | Provider name: Australian Bureau of Statistics (ABS) Provider area: Census |
Baseline year: | 2016 |
Latest reporting period: | 2021 |
Target year: | 2031 |
Disaggregations: | State and territory and Australia, by Indigenous status. State and territory and Australia, by Indigenous status, by sex. State and territory and Australia, by Indigenous status, by age. State and territory and Australia, by Indigenous status, by remoteness areas. State and territory and Australia, by Indigenous status, by Index of Relative Socio‑economic Disadvantage (IRSD) quintile. State and territory and Australia, by Indigenous status, by disability status. State and territory and Australia, by Indigenous status, by engagement category. |
Computation: | Numerator divided by Denominator multiplied by 100. Counting rules This data is for all Australian residents enumerated in the Census that reported having a usual residence in Australia. Geographical variables are based on a person’s place of usual residence (on Census night). Includes (both numerator and denominator)
Excludes (both numerator and denominator)
Disaggregations: Sex refers to a person’s biological characteristics. The 2021 Census allowed all respondents to select from three response options for the sex question: male, female and non-binary sex. Where a respondent has provided a male or female response and a non-binary sex response, the male or female response was used to determine a binary sex variable. Otherwise, sex was derived by a statistical process using random allocation. Remoteness area is classified according to the ABS Australian Statistical Geography Standard (ASGS) using SA1 as the building block. For people with incomplete/invalid or missing address information, the ABS imputes the place of usual residence. The non-response rate at the SA1 level was 4.4% in 2021. Remoteness area disaggregations exclude ‘Migratory – Offshore – Shipping’ and ‘No usual address’. Please see the How to interpret the data page for more information. Socio‑economic status of the locality is classified according to the Socio‑Economic Indexes for Areas (SEIFA): Index of Relative Socio‑economic Disadvantage (IRSD), using SA1 as the building block. For people with incomplete/invalid or missing address information, the ABS will impute the place of usual residence. The data is reported by IRSD quintile, which is determined at the Australian level and excludes persons with unknown or unavailable SEIFA score. Some individual geographic areas were excluded from SEIFA for various reasons, such as low population or high non‑response to certain Census questions. Please see the How to interpret the data page for more information. Disability is classified according to core activity need for assistance. The data is only available for people with a profound or severe core activity limitation. Disability data sourced from the Census is based on four questions to identify need for assistance and may not be fully comparable with data from other sources. See www.abs.gov.au/ausstats/abs@.nsf/mf/4431.0.55.002 for more information. (Data for people whose ‘need for assistance with core activities’ was not stated is provided for context.) Age is derived from a person’s date of birth. If date of birth is not stated, an age value is imputed by the ABS. Engagement category describes whether a person was fully engaged through employment, study (including training) or a combination of the two activities. Total includes part‑time students that were employed but away from work or hours of work were not stated, and students where the Institution was stated but student status was not stated that were working part‑time, employed but away from work or hours of work were not stated. Extraction Census Table Builder (Basic) – Employment, Income and Education: INGP X EETP (STUP X LFSP/HRSP prior to 2016) X Main ASGS (UR) X AGE5P [Disaggregations: X SEX, X REMOTE (UR), X IRSD, X ASSNP, X EETP] |
Data quality considerations: | All data values have been randomly adjusted using perturbation to avoid the release of confidential data. Proportions/rates calculated for small populations should be used with caution. |
Future reporting: | Additional disaggregations required for future reporting:
|
Supporting indicators
Driver
- Proportion of youth Not Engaged in Employment, Education or Training (NEET)
By disability, long term health condition, caring responsibility, looking for work
- Proportion of NEET by main reason for not studying in last 12 months
Contextual information
- For youth engaged in education
- type of educational institution attending (school/ technical and further education/higher education)
- highest education level completed
- For youth engaged in employment
- proportion self-employed
- proportion by occupation
- proportion by industry
- Proportion not engaged in employment, education or training (NEET)
By highest education level completed
- Progress towards parity
Material for download
- Youth are engaged in employment or education data tables (XLSX - 85 Kb)
- Youth are engaged in employment or education dataset (CSV - 160 Kb)
To assist with interpretation of the data provided (Excel data tables and CSV dataset) please refer to the target data specification above.